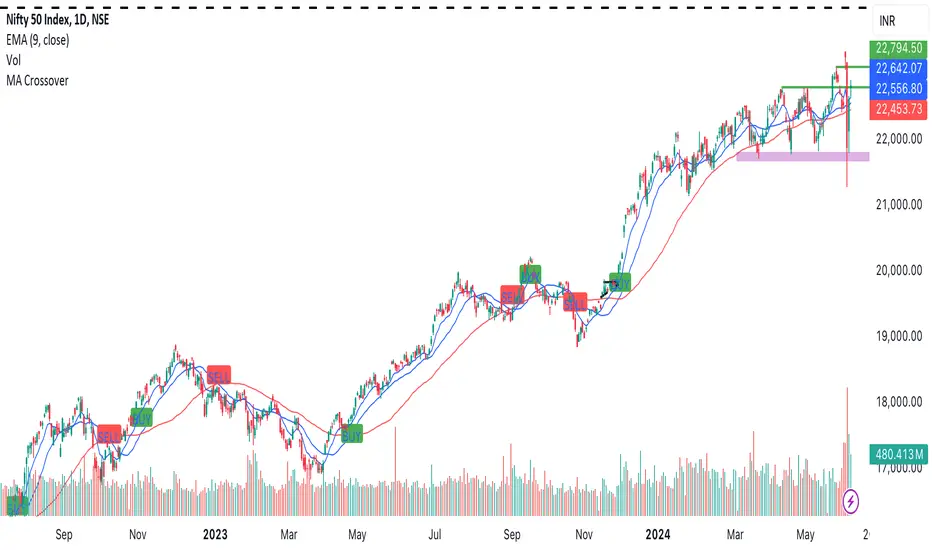
stockexploderits just for identifying moving average crossover 20 and 50 to identify trend in stocks
easily without taking much time
ค้นหาในสคริปต์สำหรับ "moving average crossover"
Engulfing CandlesticksThe Engulfing Candlesticks indicator is a powerful tool for traders and investors to identify potential reversal patterns in financial markets. This indicator is based on the popular candlestick pattern recognition technique, which has been used for centuries to predict market trends and identify trading opportunities.
The Engulfing Candlesticks indicator specifically looks for two types of patterns: Bullish Engulfing and Bearish Engulfing. A Bullish Engulfing pattern occurs when a small bearish candle is followed by a larger bullish candle that completely engulfs the previous candle, indicating a potential reversal from a downtrend to an uptrend. On the other hand, a Bearish Engulfing pattern occurs when a small bullish candle is followed by a larger bearish candle that completely engulfs the previous candle, indicating a potential reversal from an uptrend to a downtrend.
The Engulfing Candlesticks indicator is designed to be easy to use and understand, even for traders who are new to candlestick pattern recognition. The indicator plots a yellow color for Bullish Engulfing patterns and a purple color for Bearish Engulfing patterns, making it easy to visualize and identify potential trading opportunities.
One of the key benefits of the Engulfing Candlesticks indicator is its ability to identify potential reversal patterns early, allowing traders to enter trades at the beginning of a new trend. This can be especially useful in markets that are highly volatile or subject to sudden changes in direction.
In addition to its ability to identify reversal patterns, the Engulfing Candlesticks indicator can also be used as a confirmation tool for other trading strategies. For example, a trader who is using a moving average crossover strategy may use the Engulfing Candlesticks indicator to confirm the validity of the signal.
The Engulfing Candlesticks indicator is also highly customizable, allowing traders to adjust the sensitivity of the indicator to suit their individual trading style. This can be especially useful for traders who are looking to trade in specific market conditions, such as during times of high volatility or in markets with low liquidity.
Overall, the Engulfing Candlesticks indicator is a powerful tool for traders and investors who are looking to identify potential reversal patterns and trading opportunities in financial markets. Its ease of use, customization options, and ability to identify early reversal patterns make it a valuable addition to any trading strategy.
Here are the settings for the Engulfing Candlesticks indicator:
Length: This setting determines the number of bars used to calculate the engulfing pattern. A higher value will result in more precise signals, but may also reduce the number of signals generated.
Color 0: This setting determines the color used for Bullish Engulfing patterns.
Color 1: This setting determines the color used for Bearish Engulfing patterns.
Bar Color: This setting determines whether the indicator will color the bars based on the engulfing pattern.
Alerts: This setting determines whether the indicator will generate alerts when an engulfing pattern is detected.
Note: These settings may vary depending on the specific trading platform or software being used.

Supply and DemandThis is a "Supply and Demand" script designed to help traders spot potential levels of supply (resistance) and demand (support) in the market by identifying pivot points from past price action.
Differences from Other Scripts:
Unlike many pivot point scripts, this one offers a greater degree of customization and flexibility, allowing users to determine how many ranges of pivot points they wish to plot (up to 10), as well as the number of the most recent ranges to display.
Furthermore, it allows users to restrict the plotting of pivot points to specific timeframes (15 minutes, 30 minutes, 1 hour, 4 hours, and daily) using a toggle input. This is useful for traders who wish to focus on these popular trading timeframes.
This script also uses the color.new function for a more transparent plotting, which is not commonly used in many scripts.
How to Use:
The script provides two user inputs:
"Number of Ranges to Plot (1-10)": This determines how many 10-bar ranges of pivot points the script will calculate and potentially plot.
"Number of Last Ranges to Show (1-?)": This determines how many of the most recent ranges will be displayed on the chart.
"Limit to specific timeframes?": This is a toggle switch. When turned on, the script only plots pivot points if the current timeframe is one of the following: 15 minutes, 30 minutes, 1 hour, 4 hours, or daily.
The pivot points are plotted as circles on the chart, with pivot highs in red and pivot lows in green. The transparency level of these plots can be adjusted in the script.
Market and Conditions:
This script is versatile and can be used in any market, including Forex, commodities, indices, or cryptocurrencies. It's best used in trending markets where supply and demand levels are more likely to be respected. However, like all technical analysis tools, it's not foolproof and should be used in conjunction with other indicators and analysis techniques to confirm signals and manage risk.
A technical analyst, or technician, uses chart patterns and indicators to predict future price movements. The "Supply and Demand" script in question can be an invaluable tool for a technical analyst for the following reasons:
Identifying Support and Resistance Levels : The pivot points plotted by this script can act as potential levels of support and resistance. When the price of an asset approaches these pivot points, it might bounce back (in case of support) or retreat (in case of resistance). These levels can be used to set stop-loss and take-profit points.
Timeframe Analysis : The ability to limit the plotting of pivot points to specific timeframes is useful for multiple timeframe analysis. For instance, a trader might use a longer timeframe to determine the overall trend and a shorter one to decide the optimal entry and exit points.
Customization : The user inputs provided by the script allow a technician to customize the ranges of pivot points according to their unique trading strategy. They can choose the number of ranges to plot and the number of the most recent ranges to display on the chart.
Confirmation of Other Indicators : If a pivot point coincides with a signal from another indicator (for instance, a moving average crossover or a relative strength index (RSI) divergence), it could provide further confirmation of that signal, increasing the chances of a successful trade.
Transparency in Plots : The use of the color.new function allows for more transparent plotting. This feature can prevent the chart from becoming too cluttered when multiple ranges of pivot points are plotted, making it easier for the analyst to interpret the data.
In summary, this script can be used by a technical analyst to pinpoint potential trading opportunities, validate signals from other indicators, and customize the display of pivot points to suit their individual trading style and strategy. Always remember, however, that no single indicator should be used in isolation, and effective risk management strategies should always be employed.

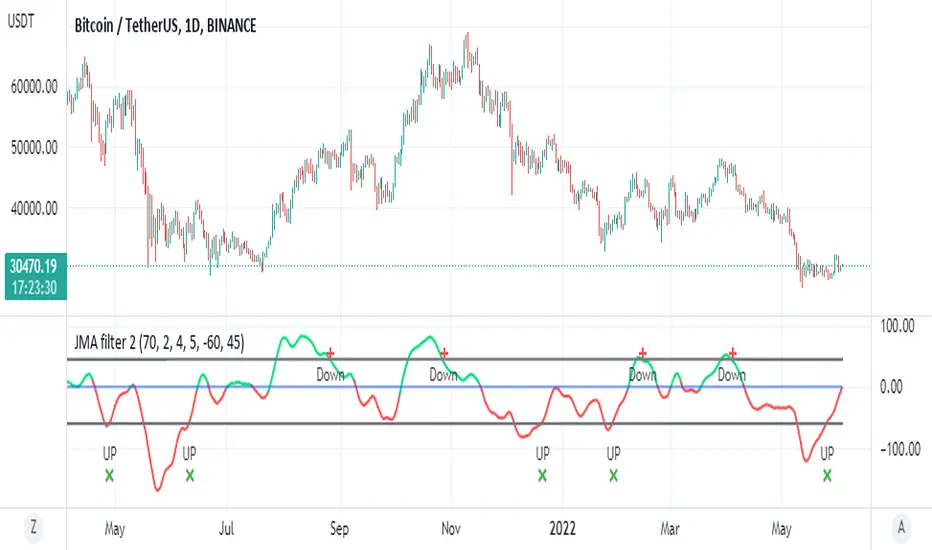
JMA filter 2This is based on ChuckBanger Juric indicator (a modification of it)
things you need to know how to work with this one
to control the wave setting you need to adjust the length , slow ,fast and c in menu for optimal result
positive trend is above zero in green
negative trend bellow zero red
the best part herein this indicator is to finding of high and low based on lower treshold =trel
higher threshold for high =treh
there is signals once it crossed up or down
for each time frame you need to set the threshold for optimal results as it change for each TF it will be different so be careful about it
so rule of thumb is to look for the previous peaks either up or down and to set the threshold according to it
it more sensitive then RSI to my opinion and very good to detect sweet spot either for sell or buy
one can add alerts (not included)
or modify it to make it better
here on Tesla
VWAP Bands - Event Based [LuxAlgo]This indicator returns VWAP bands with a degree of smoothness resetting based on various user-selected events. The bands are constructed using a VWAP based naive standard deviation.
The indicator can be anchored or start from the first bar and can be used as trailing support/resistance, in a moving average crossover system, or as source for external indicators.
Settings
Start: VWAP anchor point
Start At First Bar: Display the VWAP from the first bar instead of a specified anchor point
VWAP
Length: Controls certain characteristics of the user-selected event
Mult: Multiplicative factor for the VWAP standard deviation
Source: Price source of the indicator
Event
Event: Determines the event resetting the degree of smoothness of the VWAP
External Cross/Event: Input source used for external crosses/events
Further details about the available events are given below.
Details
Various event conditions are available to the users. When the selected event occurs, the VWAP equals the current closing price.
By default, the event is periodic, that is the VWAP resets periodically, with a period determined by the Length setting.
The Higher High event resets the VWAP when a new higher high occurs.
The Lower Low event resets the VWAP when a new lower low occurs.
The Trend Change event is similar however resets the VWAP only once a higher high or lower low occurs. Higher highs and lower lows are given by Donchian channels with a period determined by the Length setting.
The Start event reset the VWAP at the selected anchor point (or first bar if the "Start At First Bar" setting is selected). This can be useful if one only needs a regular anchored VWAP band indicator.
The External Cross event resets the VWAP when the Source price crosses the series selected in the External Cross/Event setting. In the image above the VWAP resets when the price crosses the volatility stop indicator.
The External Event resets the indicator when a series selected in the External Cross/Event setting is not equal to 0. This allows using a custom event in order to reset the VWAP. In the above example the VWAP is reset during a new session due to the External Session indicator.
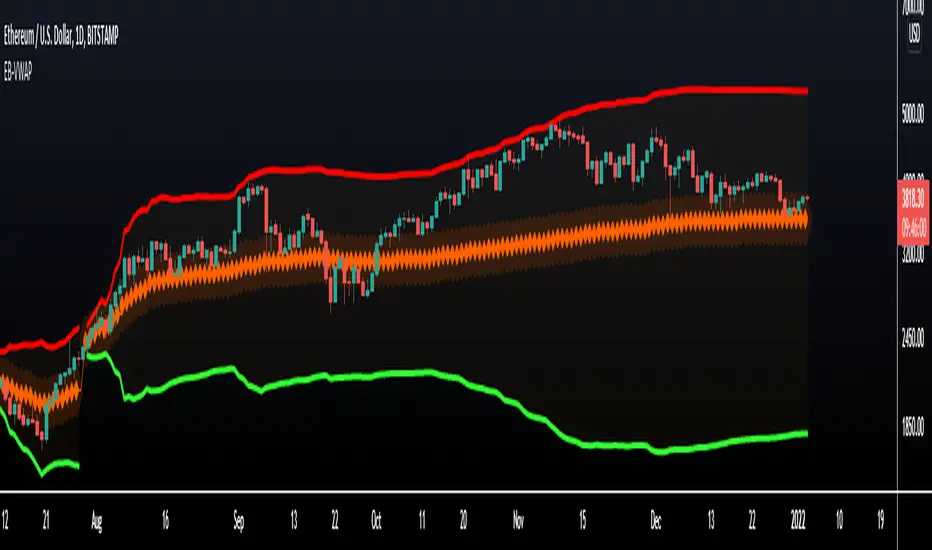
JMA filter 1This my adapt version of juric filter
I took the script from chuck berger
I just add my adaptation to it
i think it make this filter more accurate
Lazy Bear is the original creator of this filter
by time it has many version
So I try to make my to this great script
buy is lime
sell is red
thanks to original authors
tesla
dow 30
etc etc:)

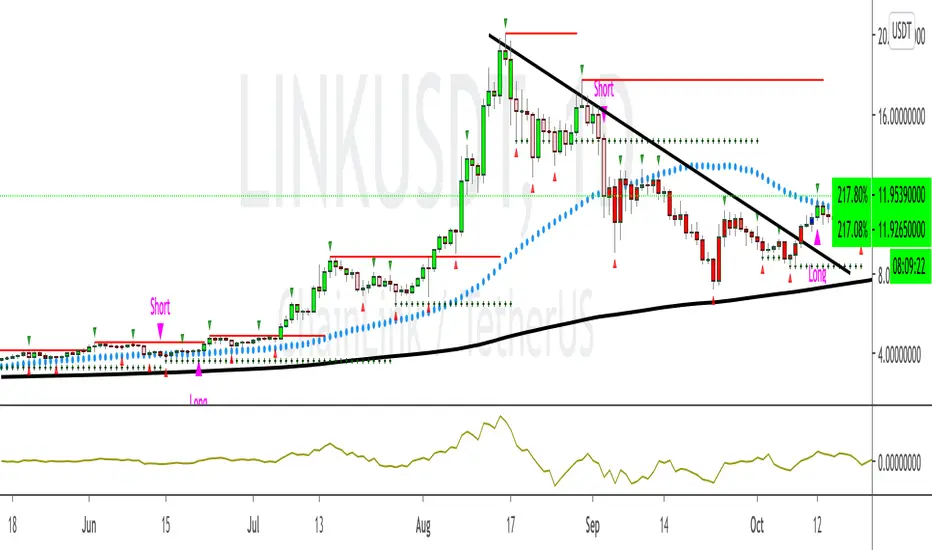
Buy/Sell_Trend_IndicatorThis is an improved version of my earlier script, the objective of the script is to provide simple trading entry and exist based on Moving average crossover as a foundation with some dependent conditions.
This trend following system allows a trader to capture the maximum benefit in a trade from entry to exit while it doesn't guaranteed a top or a bottom exit / entry, the trader will be able to setup an entry signal, and follow up on the trade with stop loss adjustment during the entire trade.
this is mainly targeted at new traders looking to trade profitably without blowing up their account.
I am open to feedback.
regards

(JS) Moving Average Crossover OscillatorPretty simple really - another indicator I built with the intention of keeping the price action as clear as possible.
This oscillator is pretty generic;
-You have a choice between two SMA or two EMA which you simply just check the box to decide.
-There is a box you can check to use the resolution on your chart, or you can turn it off and use a custom resolution instead.
-The oscillator is graphed on the percentage of distance - so positive 4 means the fast MA is 4% above the slow one.
I like to see the price action clearly without obstruction - so I hope that people who share my view like this as much as I do.
Enjoy!
PpSignal The Ultimate Moving Average Crossover 4.0VMA with linear regression smoothe haiken ashi and supertrend bollinguer trend direction

TRIPLE MOVING AVERAGE CROSSOVERStrategy involving 3 EMA (customizable settings) for letting you know when to long or short the market.

Richard Carey - Crypto Appropriate EWMACAn exponentially weighted moving average crossover strategy with variable MA types and Fast Slow periods.
